
Axle Flow Dashboard Overview
The Dashboard gives you a centralized view of your company’s operations—from revenue and expenses to driver activity, load volume, and fleet efficiency.
🎥🔷 Video Guide for Axle Flow Dashboard/Overview 🔷🎥
Navigating the Dashboard
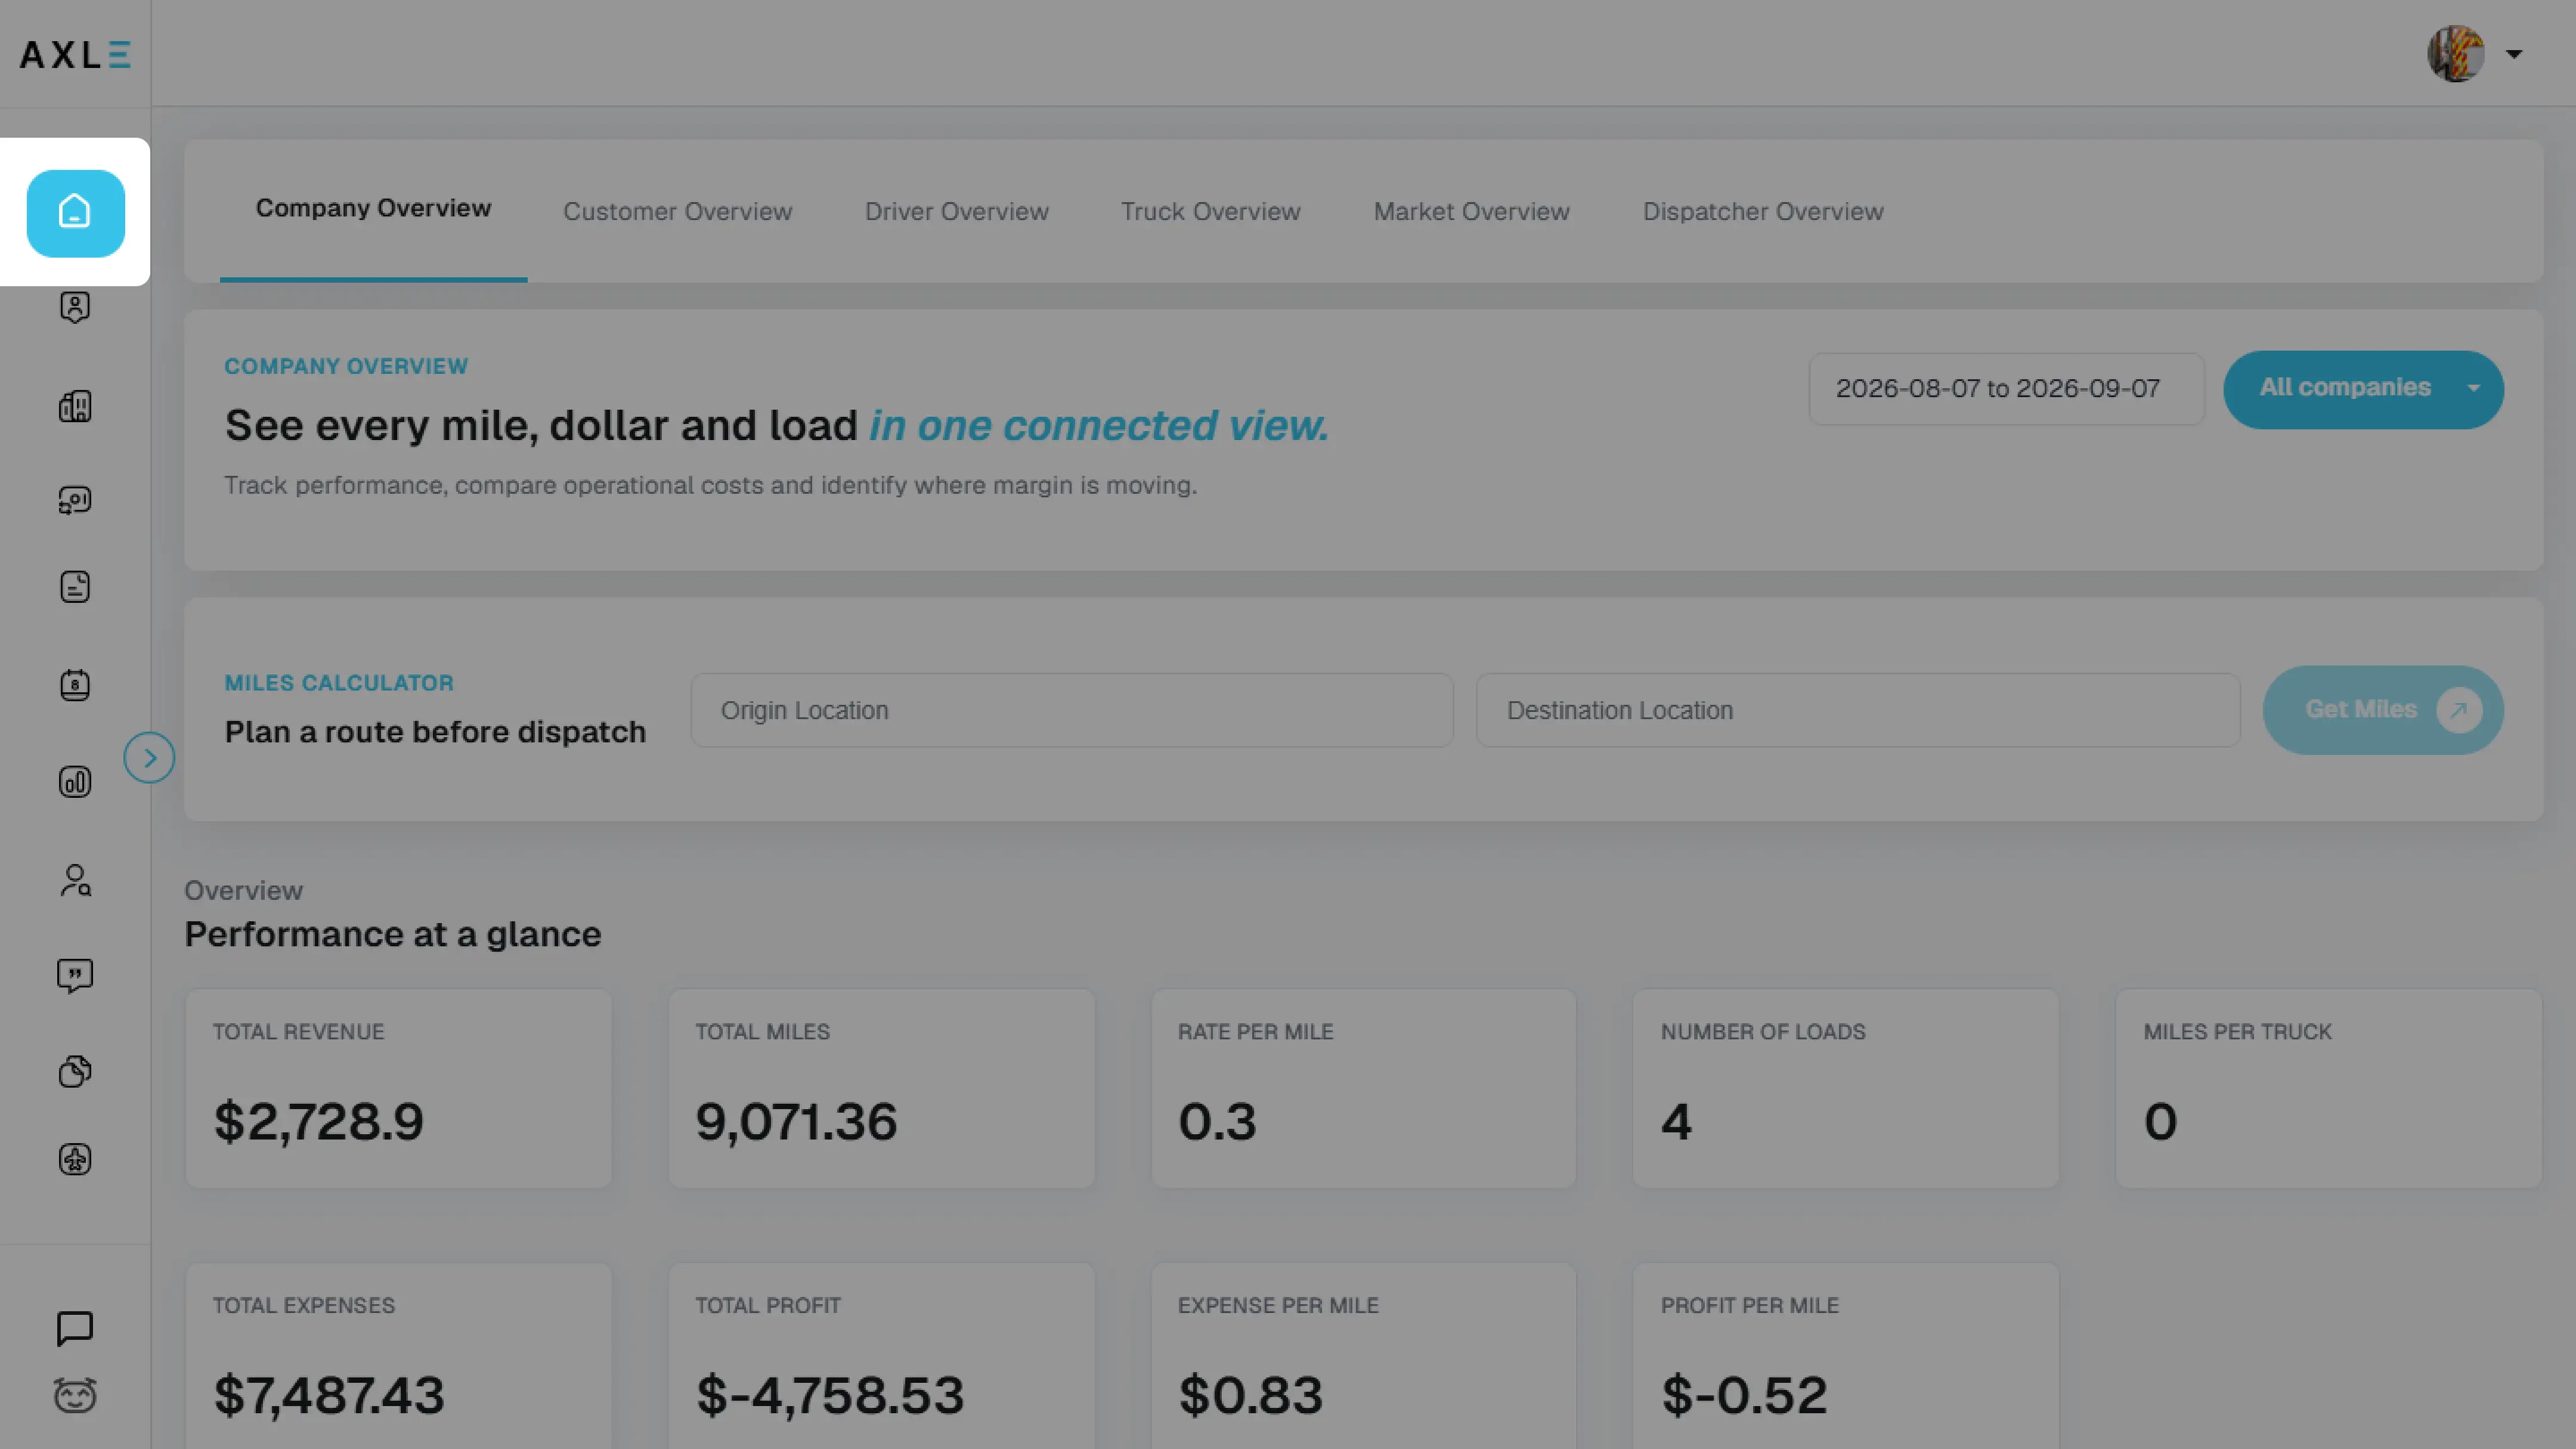
When you log in, the Dashboard Home shows your company’s key metrics.
- Use the arrow at the bottom-left to expand the navigation panel and easily move between modules like loads, accounting, assets, and more.
Home Dashboard Features
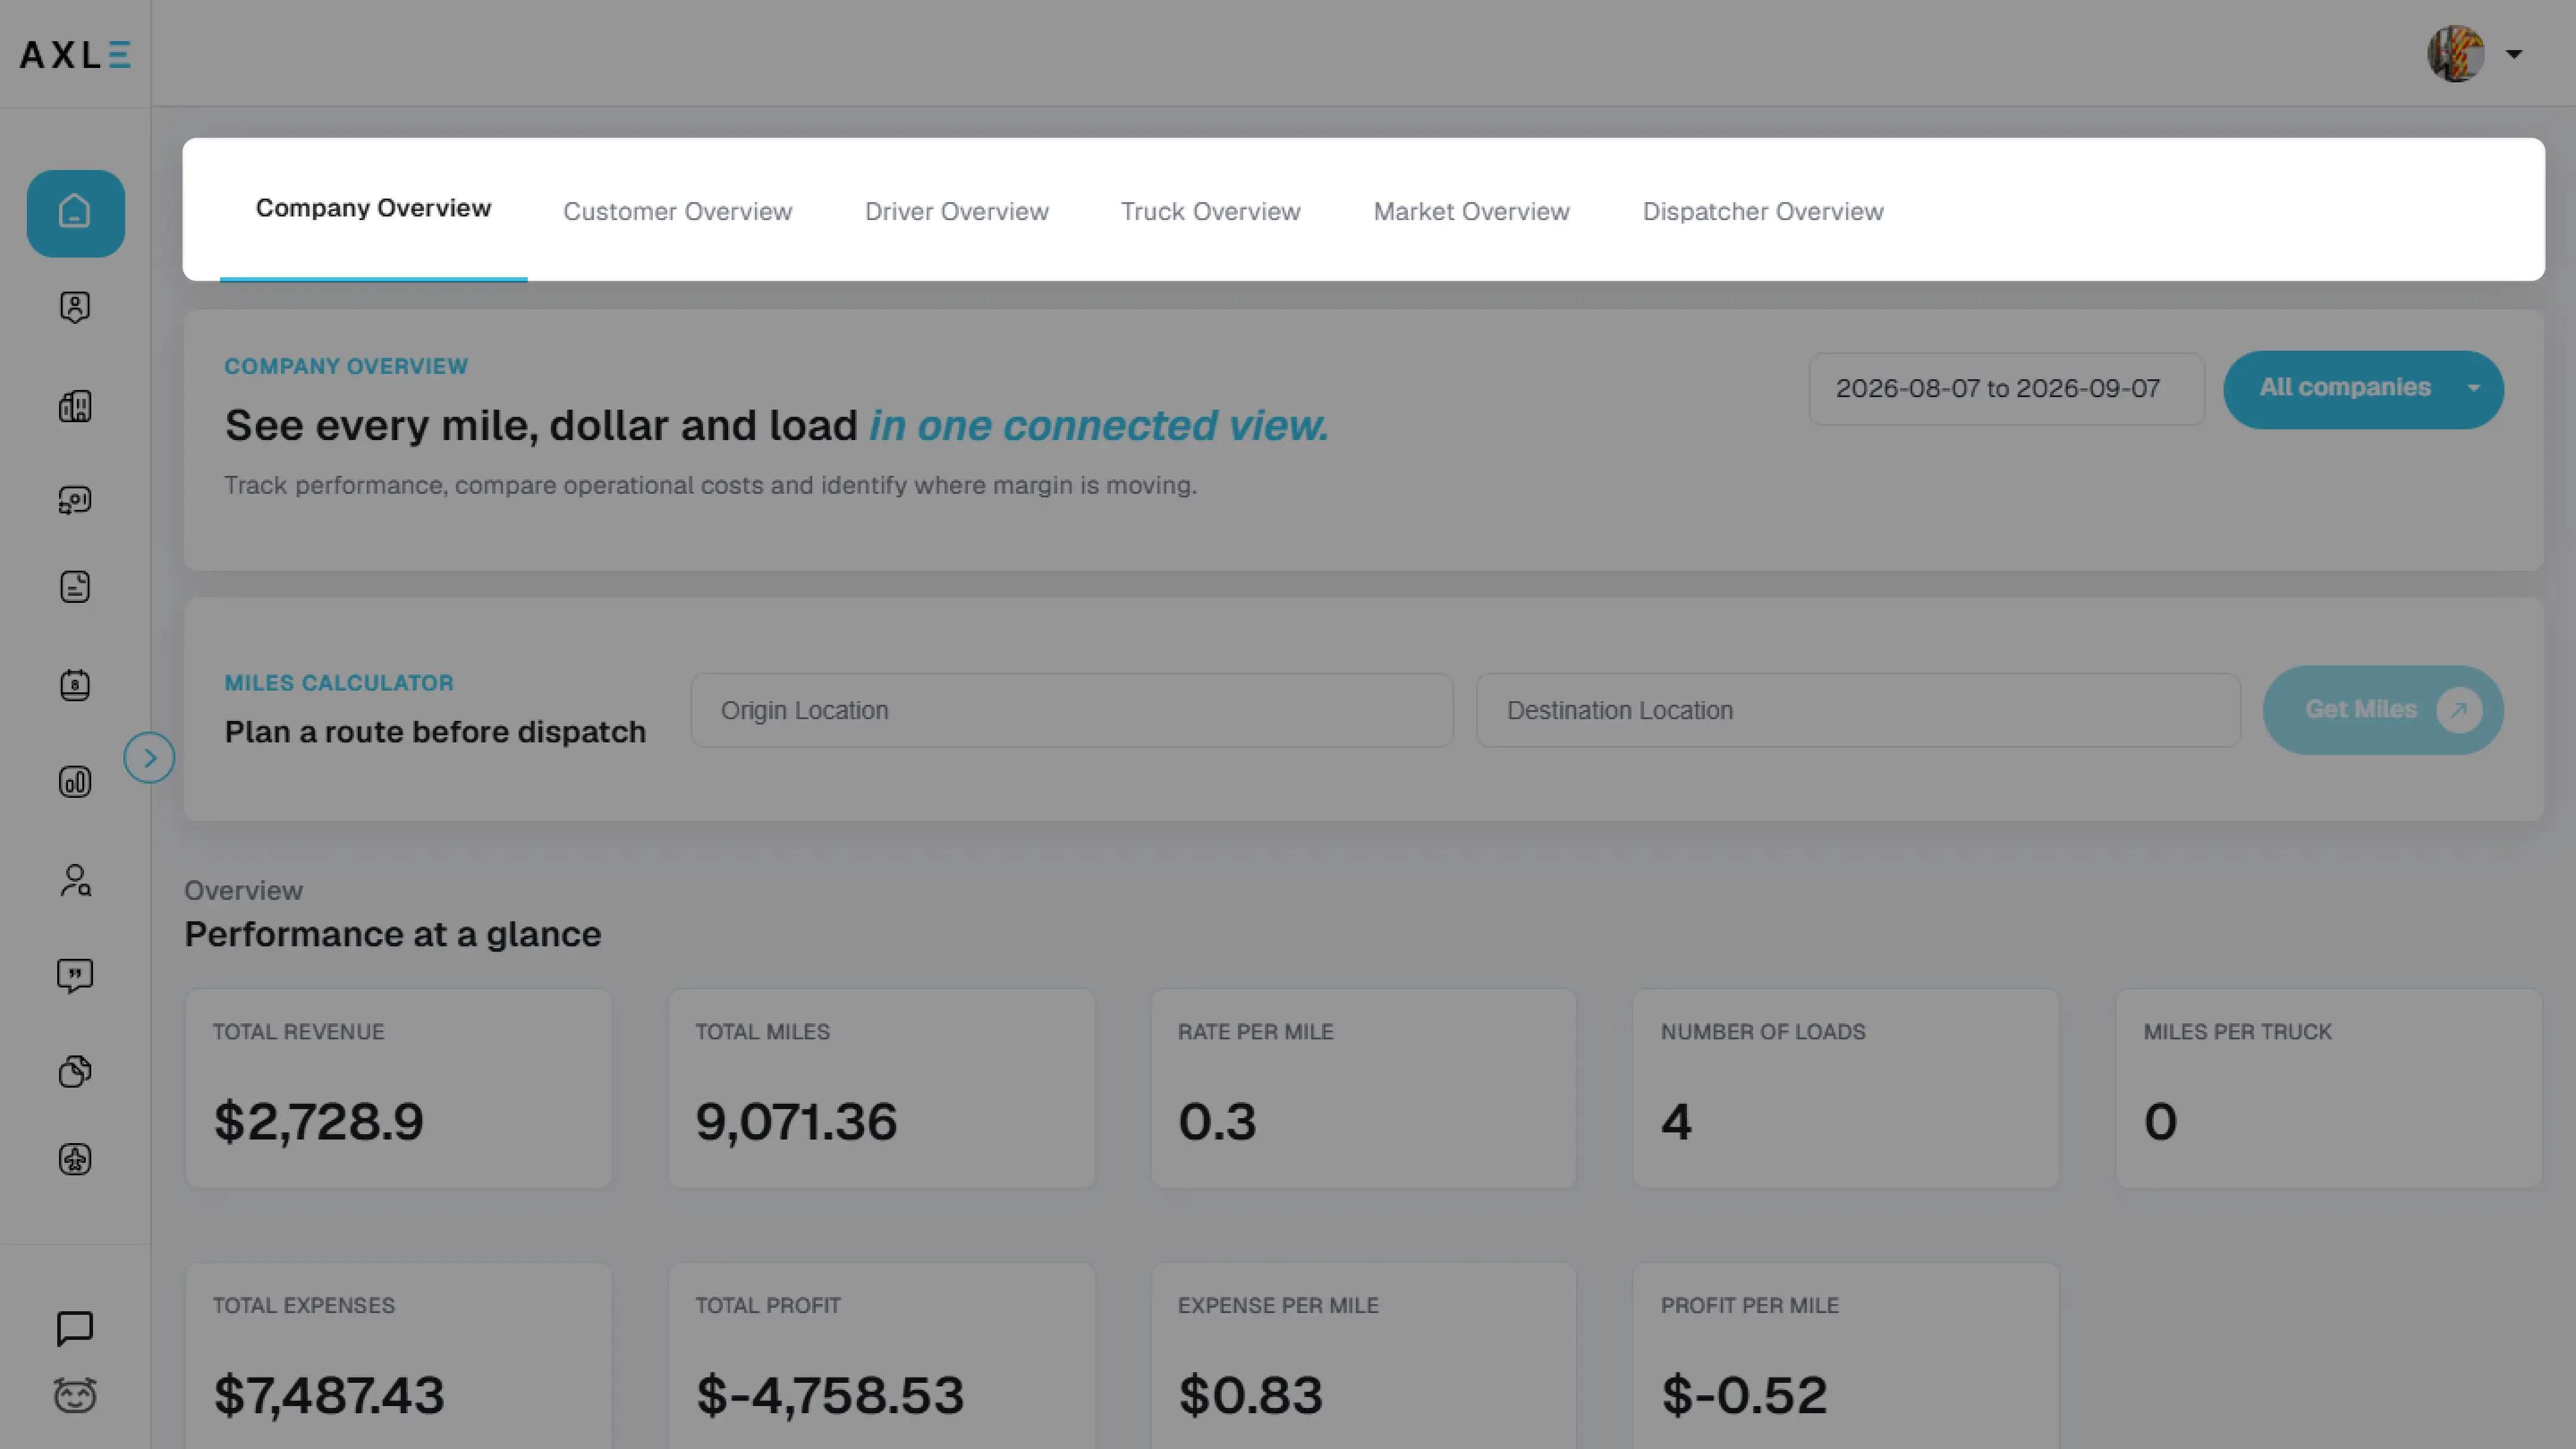
The Axle Flow dashboard is divided into multiple sections, each providing valuable insights into different aspects of a trucking business. These include:
- Company Overview → Track Your Financial Performance
- Driver Overview → Compare Driver Productivity
- Truck Overview → Monitor Fleet Efficiency
- Market Overview → Stay Ahead of Rate Trends
- Dispatcher Overview → Measure Dispatcher Output
Company Overview – Financial Snapshot
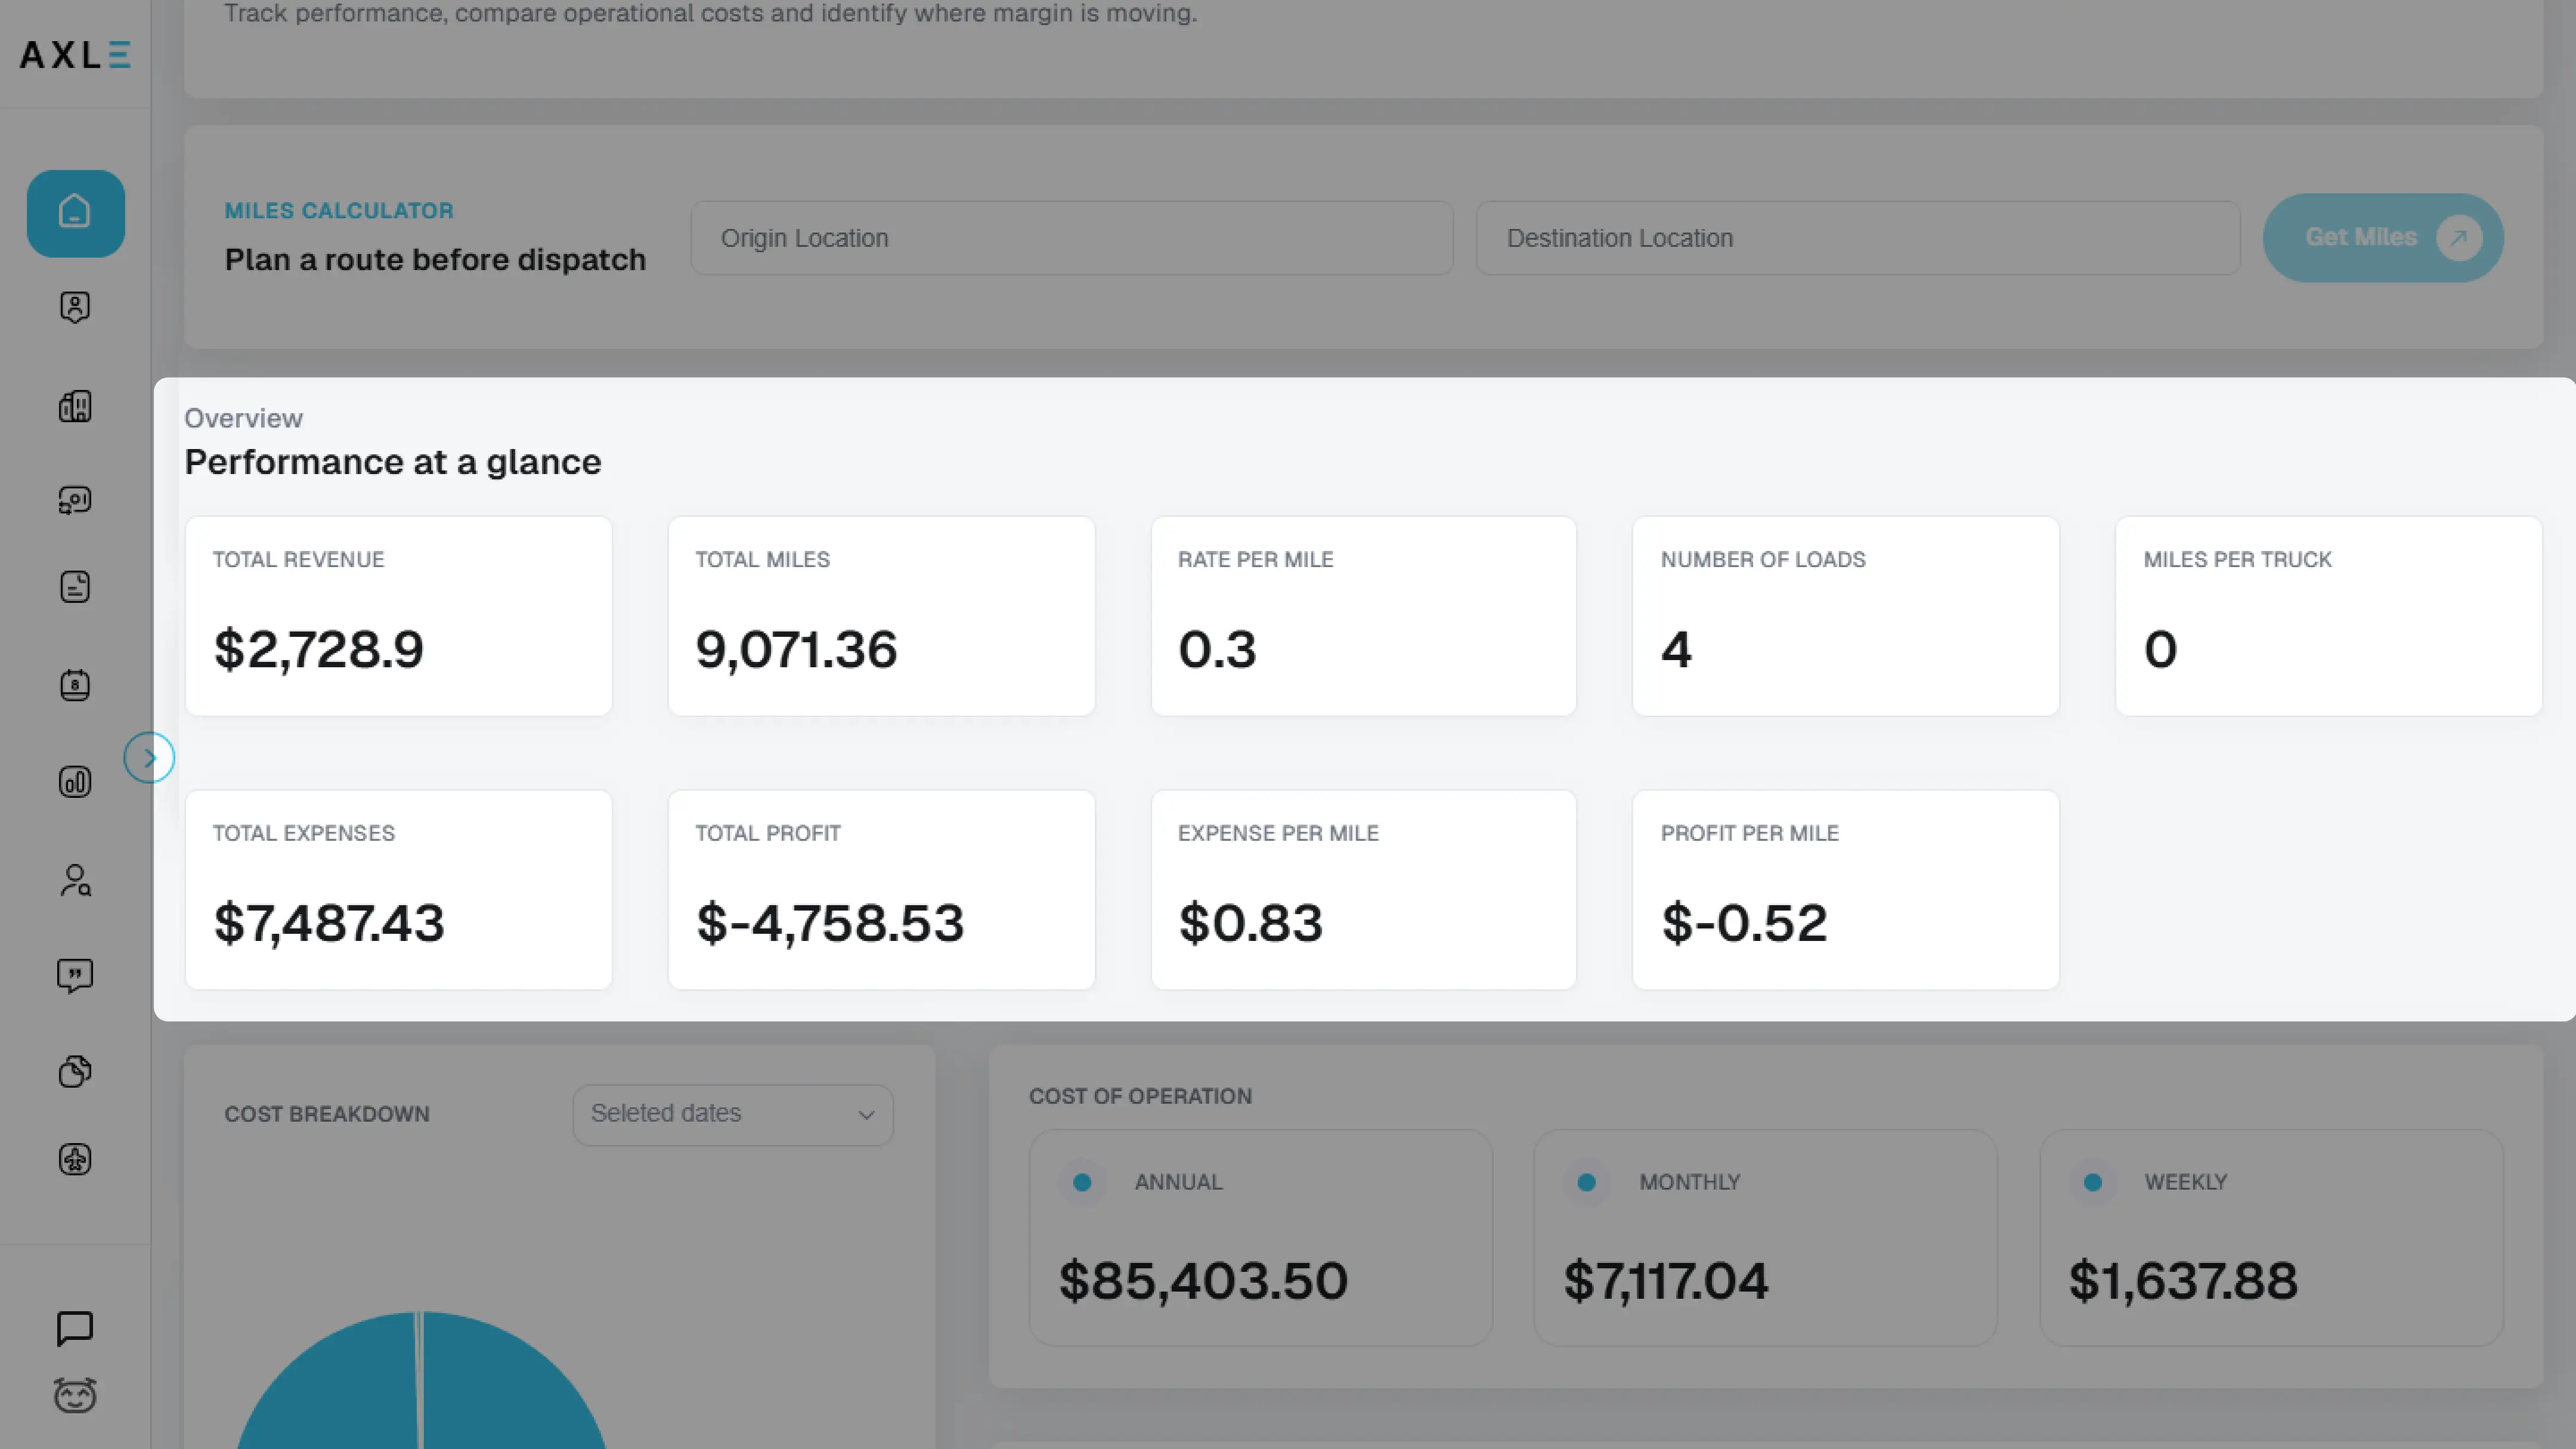
Shows a high-level summary of your company’s financial and operational performance.
Key Metrics:
- Total Revenue
- Total Profit (Annual, Monthly, Weekly)
- Total Miles Driven
- Rate per Mile
- Cost of Operation
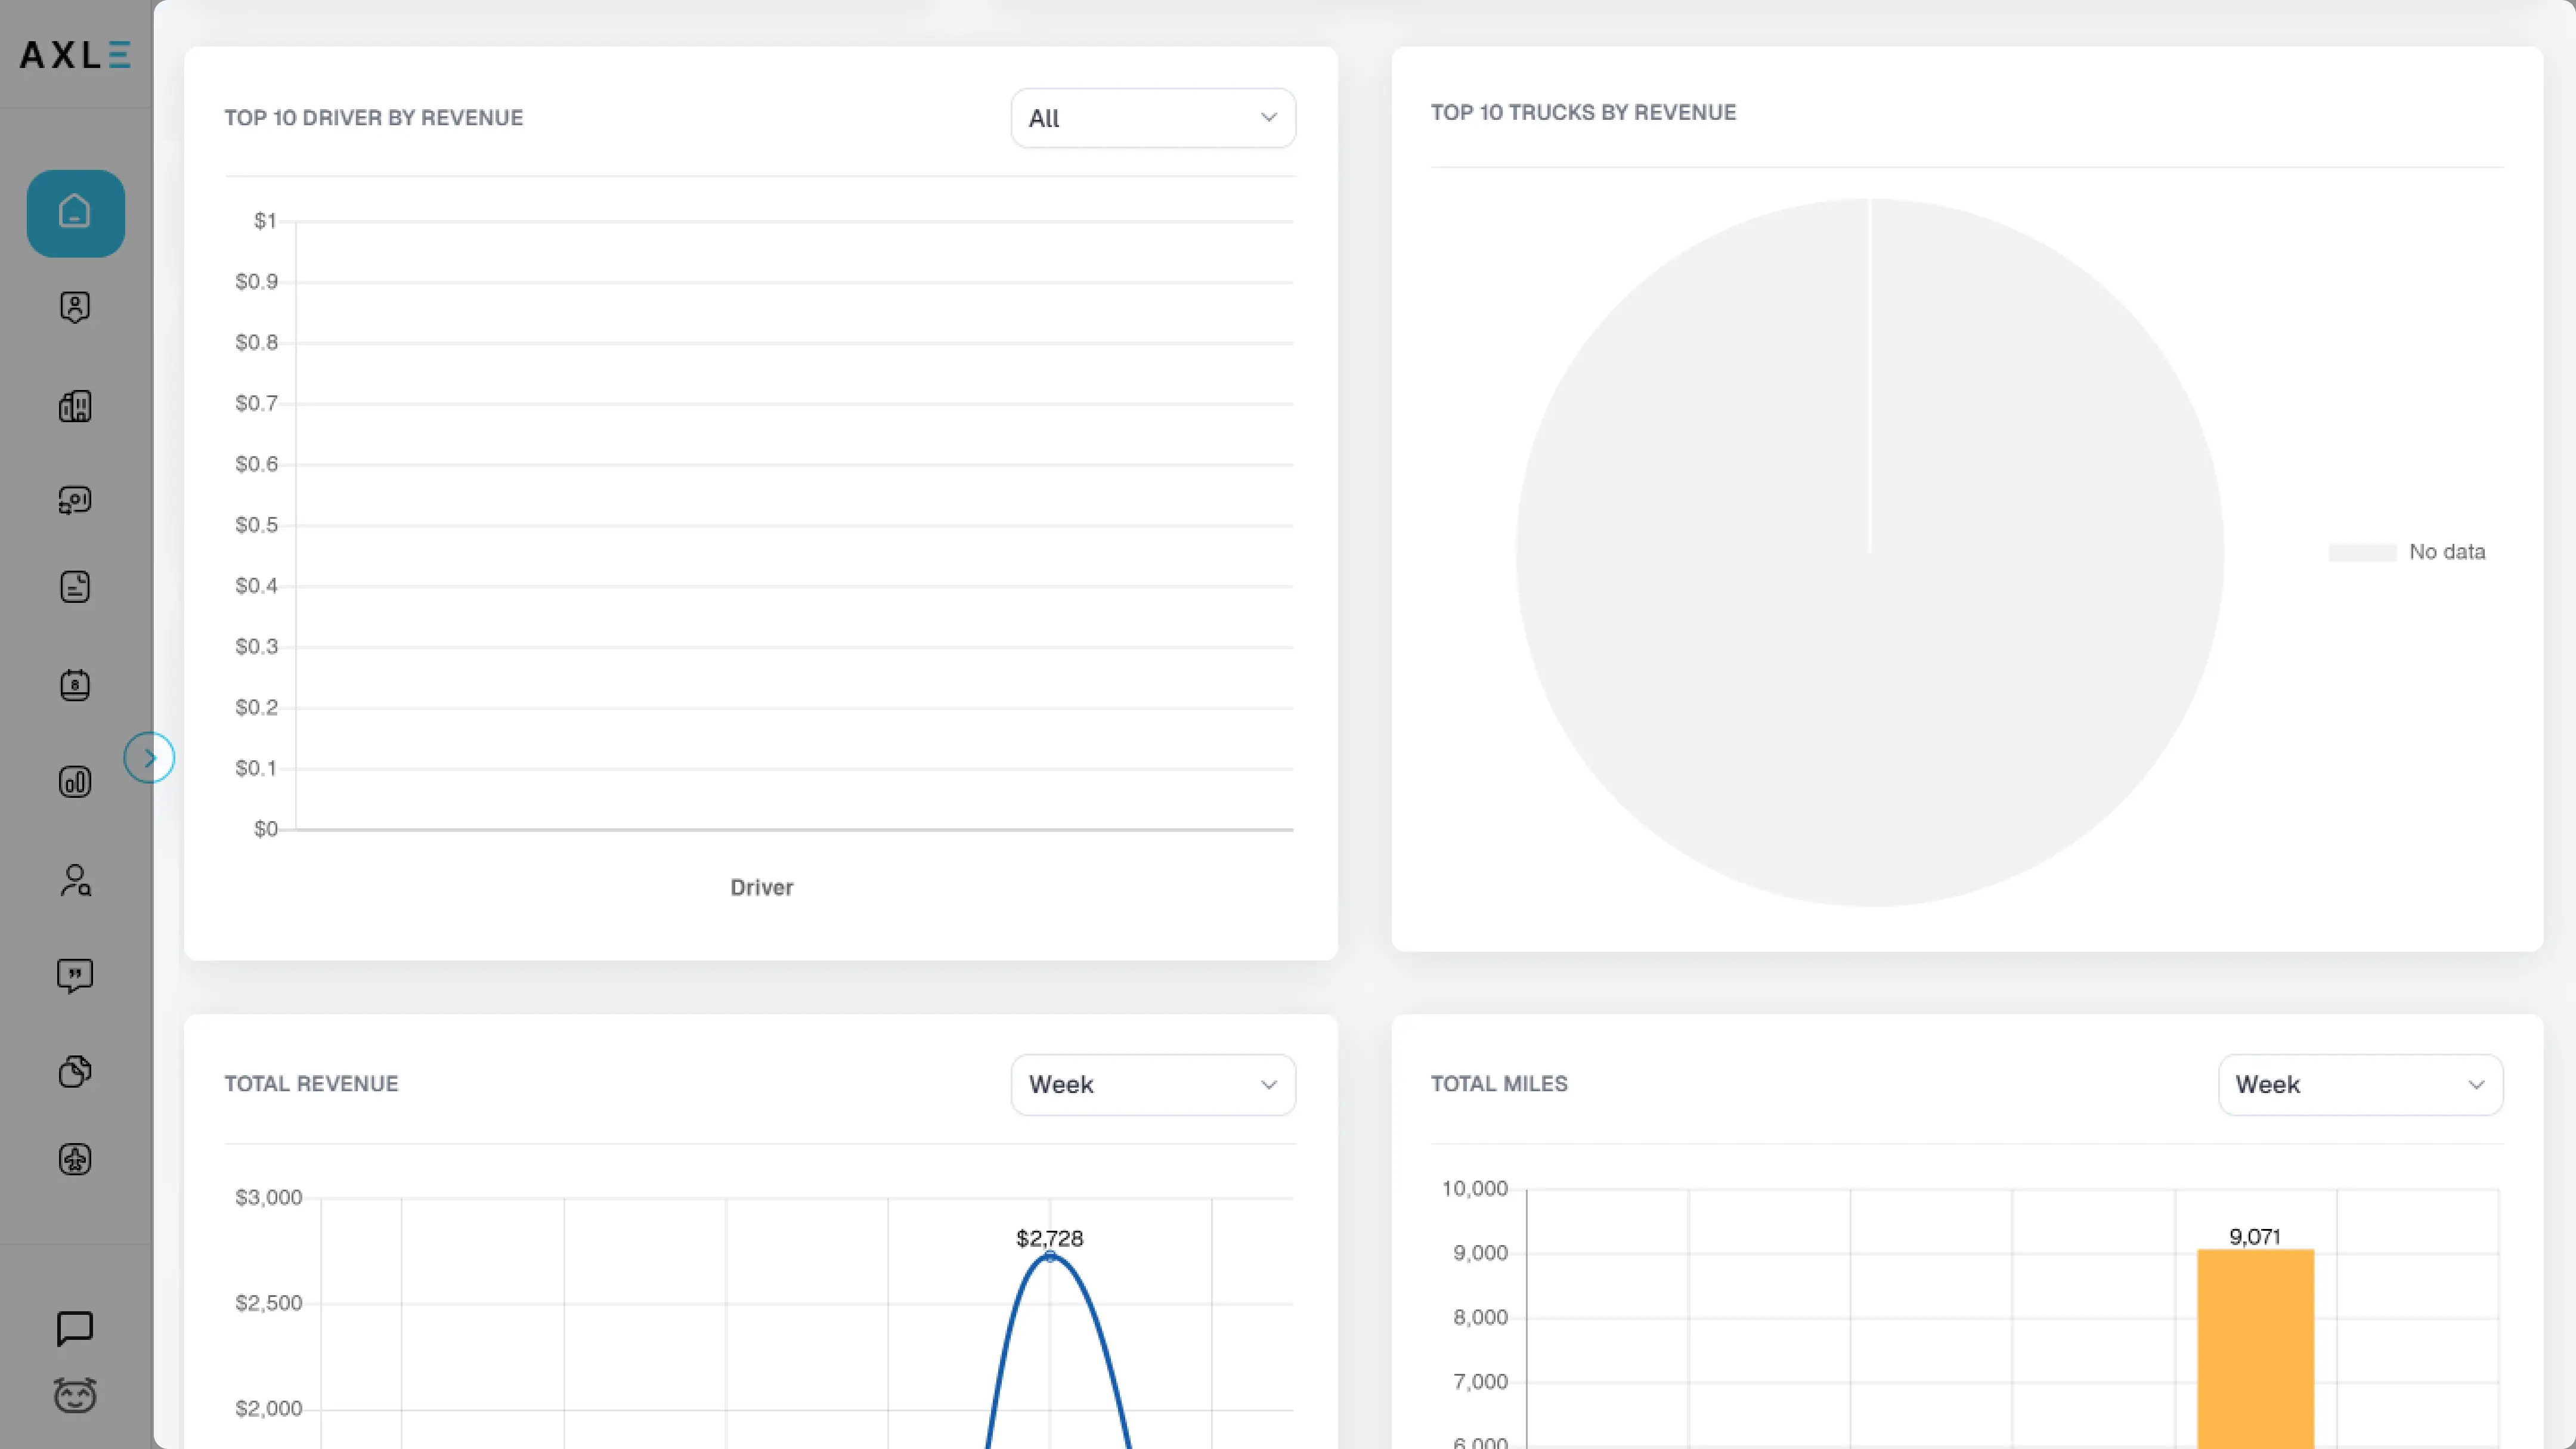
Visual Insights:
- Top 10 Drivers by Revenue
- Top 10 Trucks by Revenue
- Revenue and mileage graphs for trend analysis
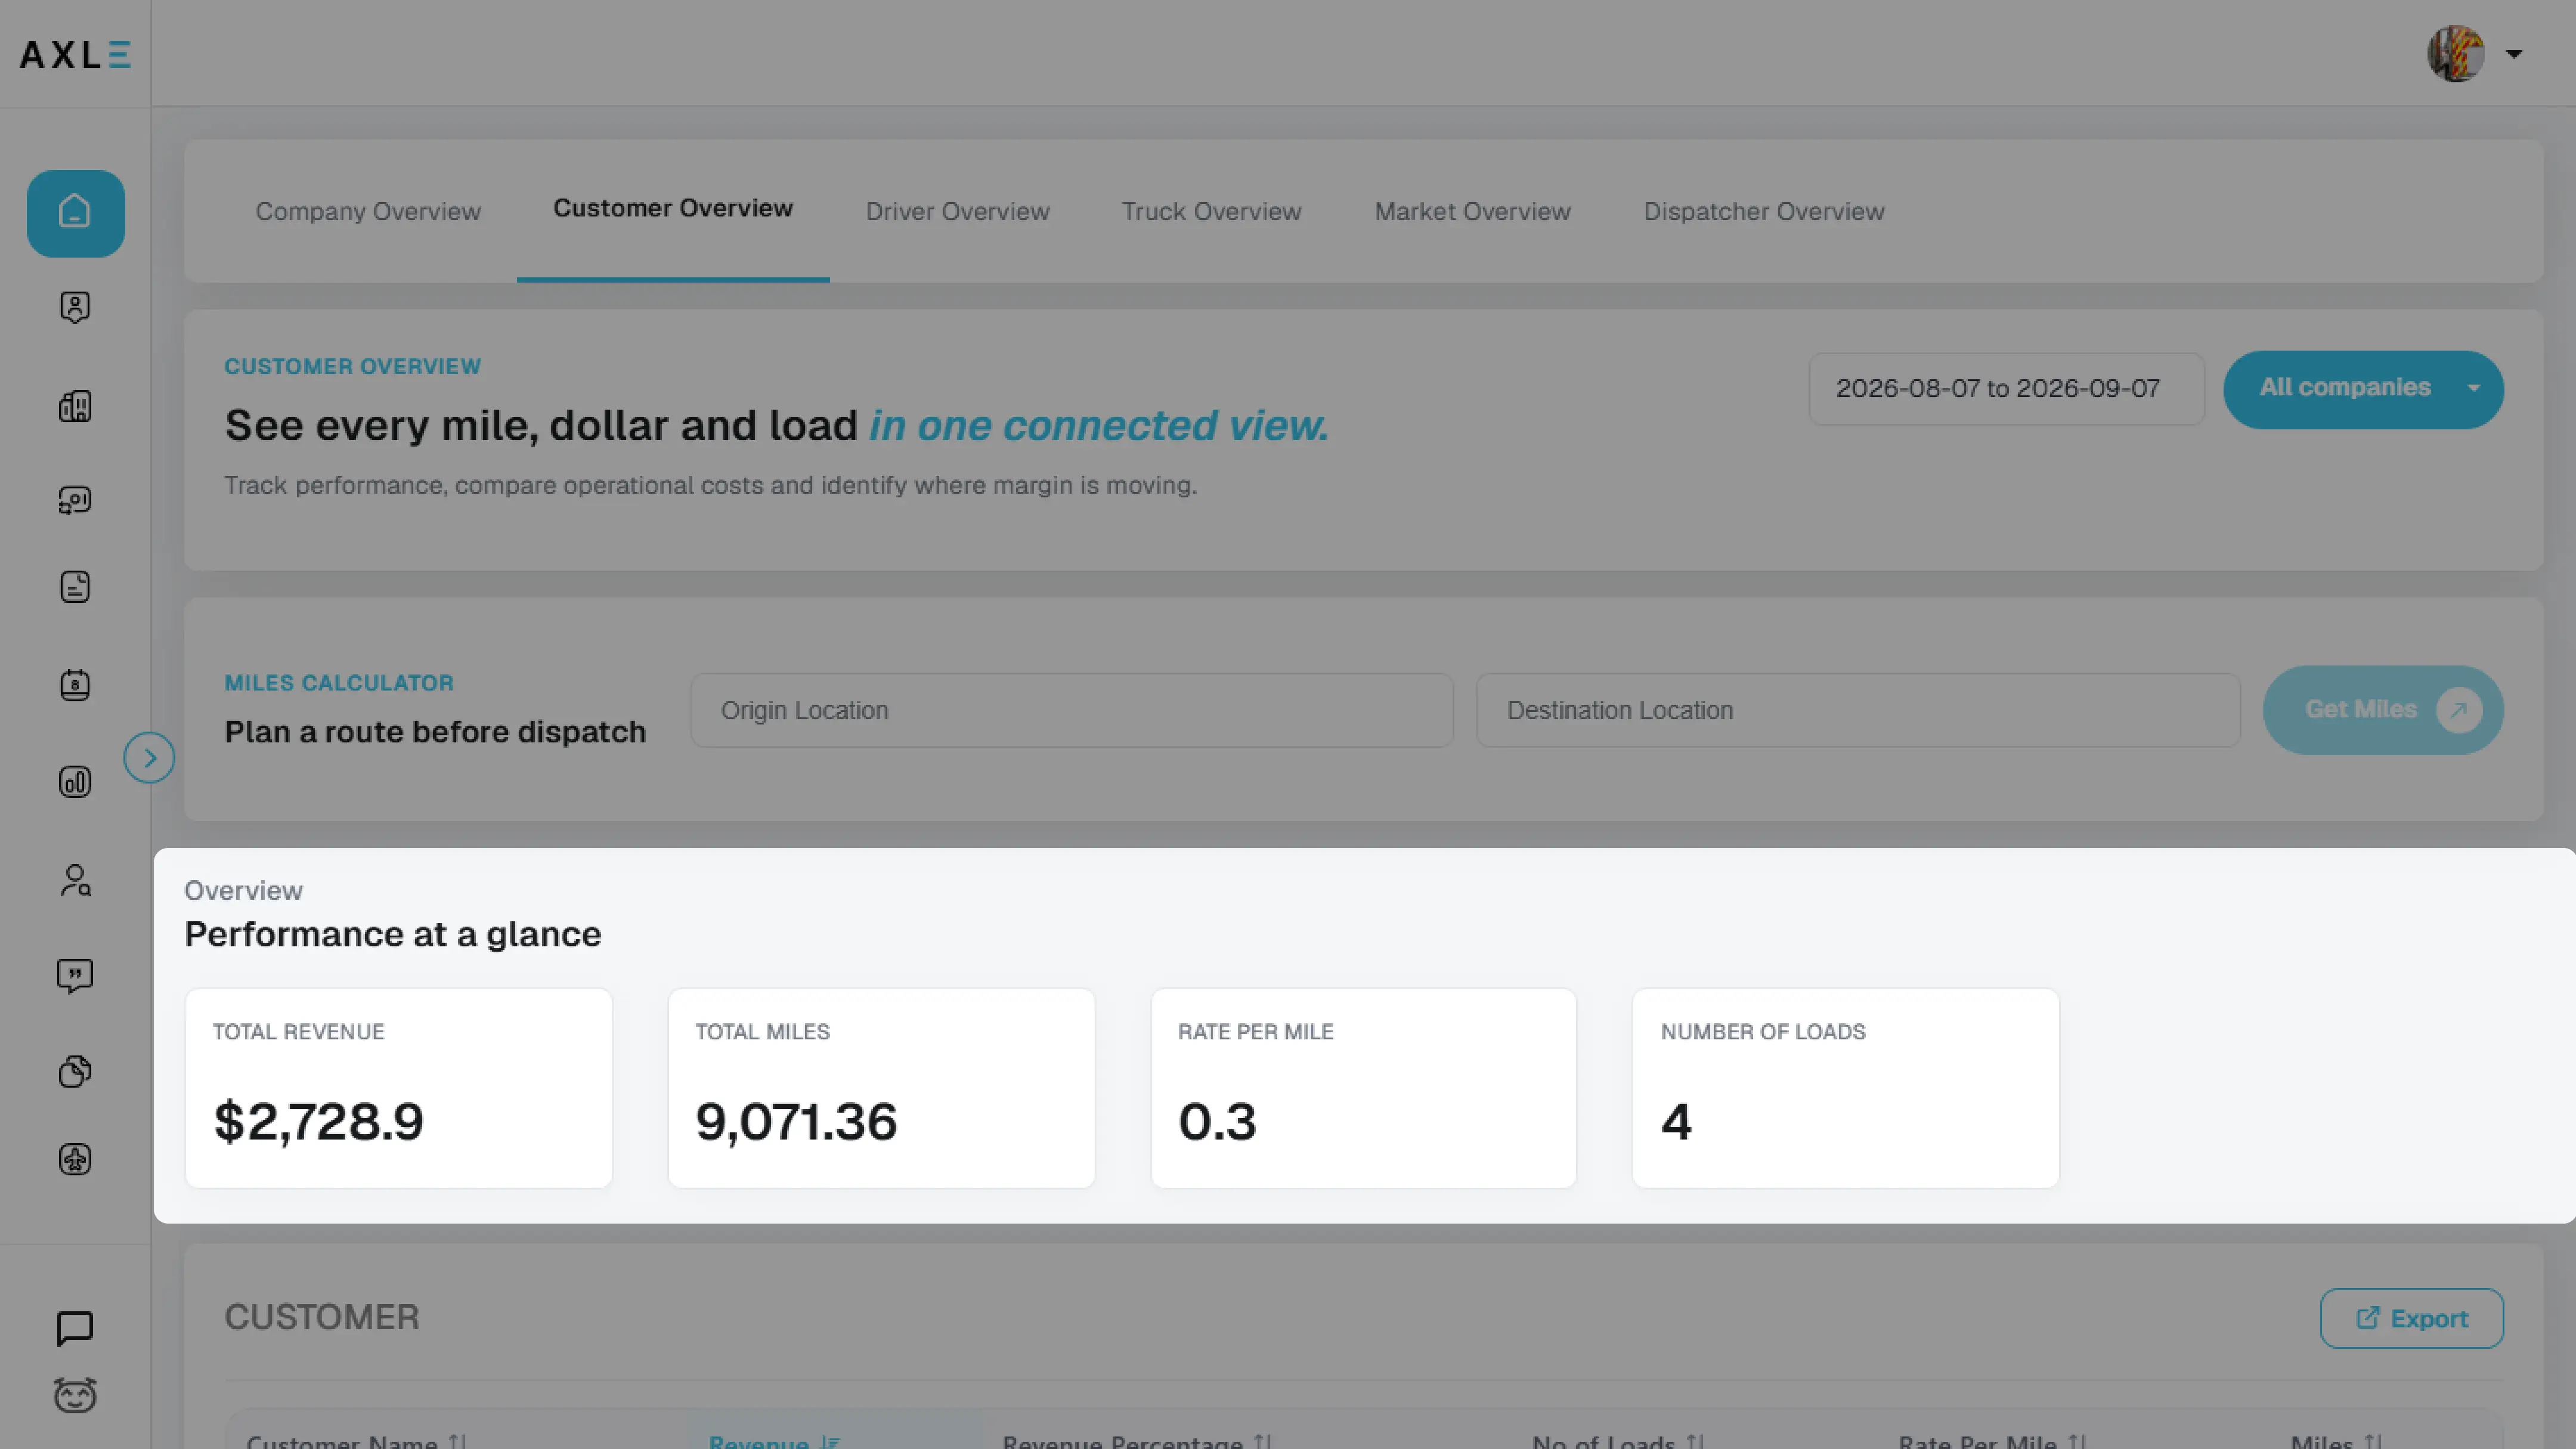
Customer Overview – Revenue by Customer
Breaks down performance by customer so you can identify top accounts and areas for improvement.
Key Metrics:
- Total Revenue per Customer
- Total Miles
- Rate per Mile
- Number of Loads
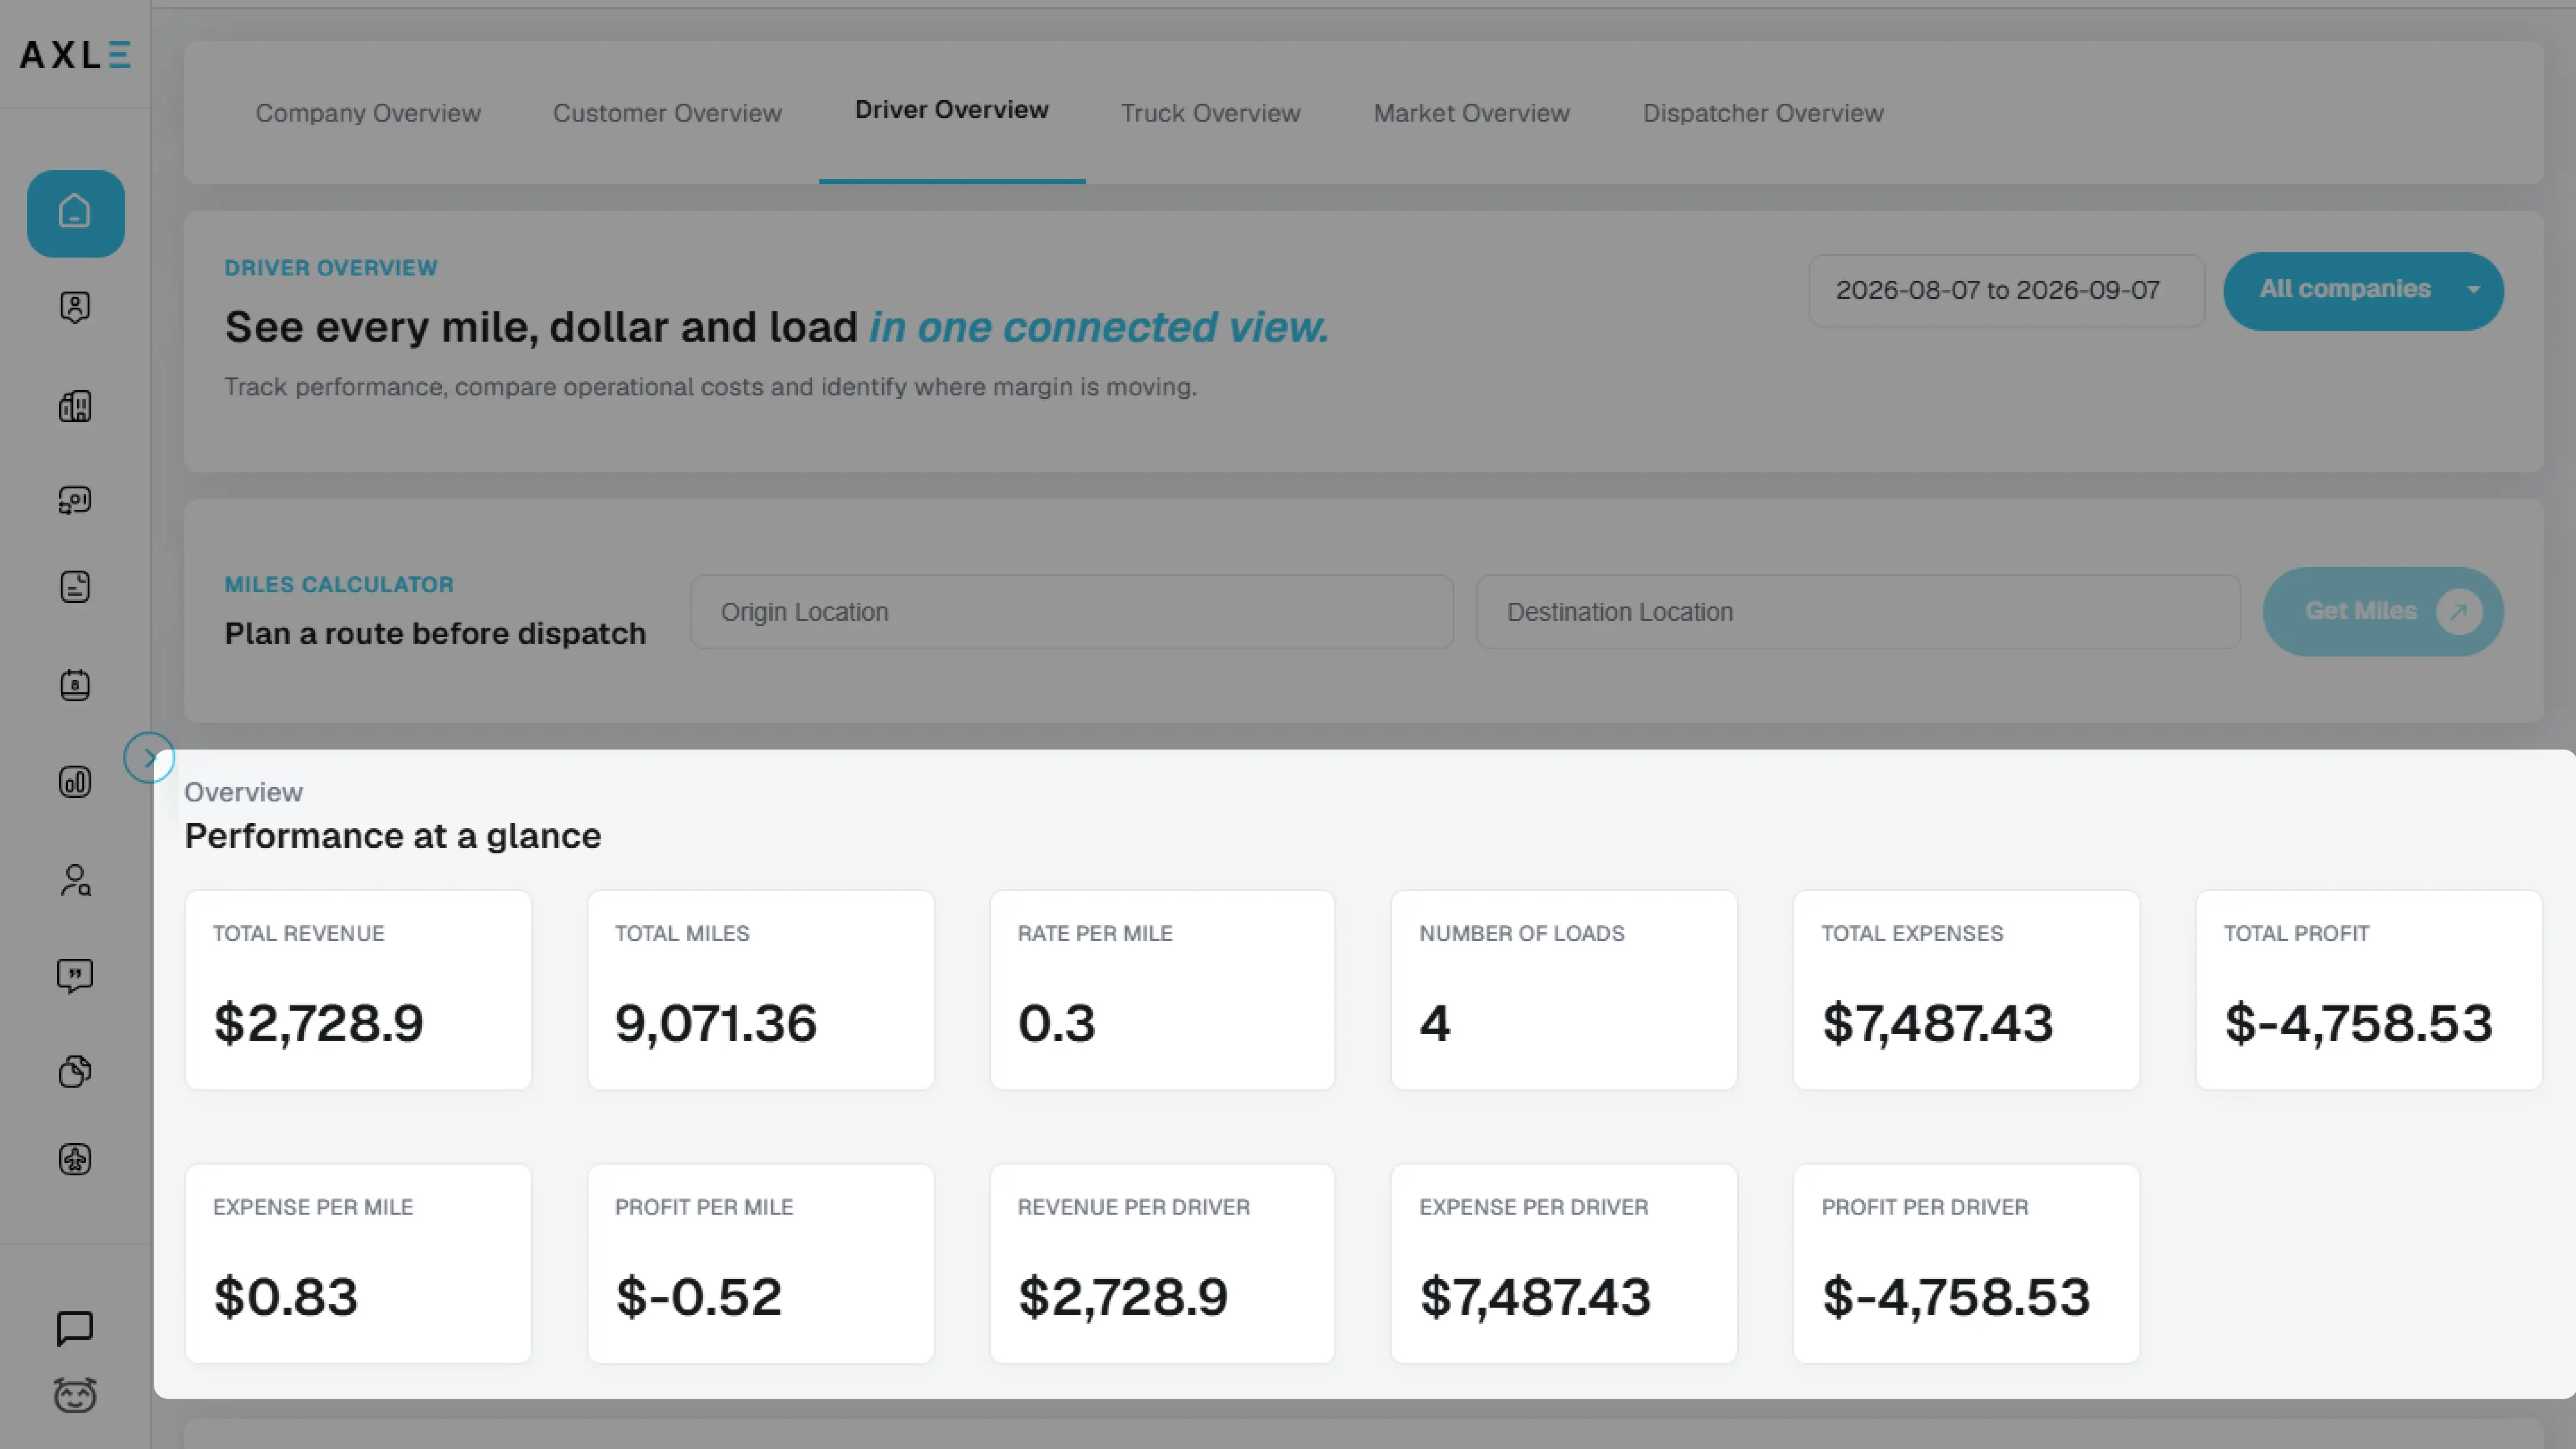
Driver Overview – Performance Tracking
Helps you evaluate driver performance and profitability.
Key Metrics:
- Revenue per Driver
- Driver Pay & Fuel Expenses
- Total Profit per Driver
- Total Miles Driven
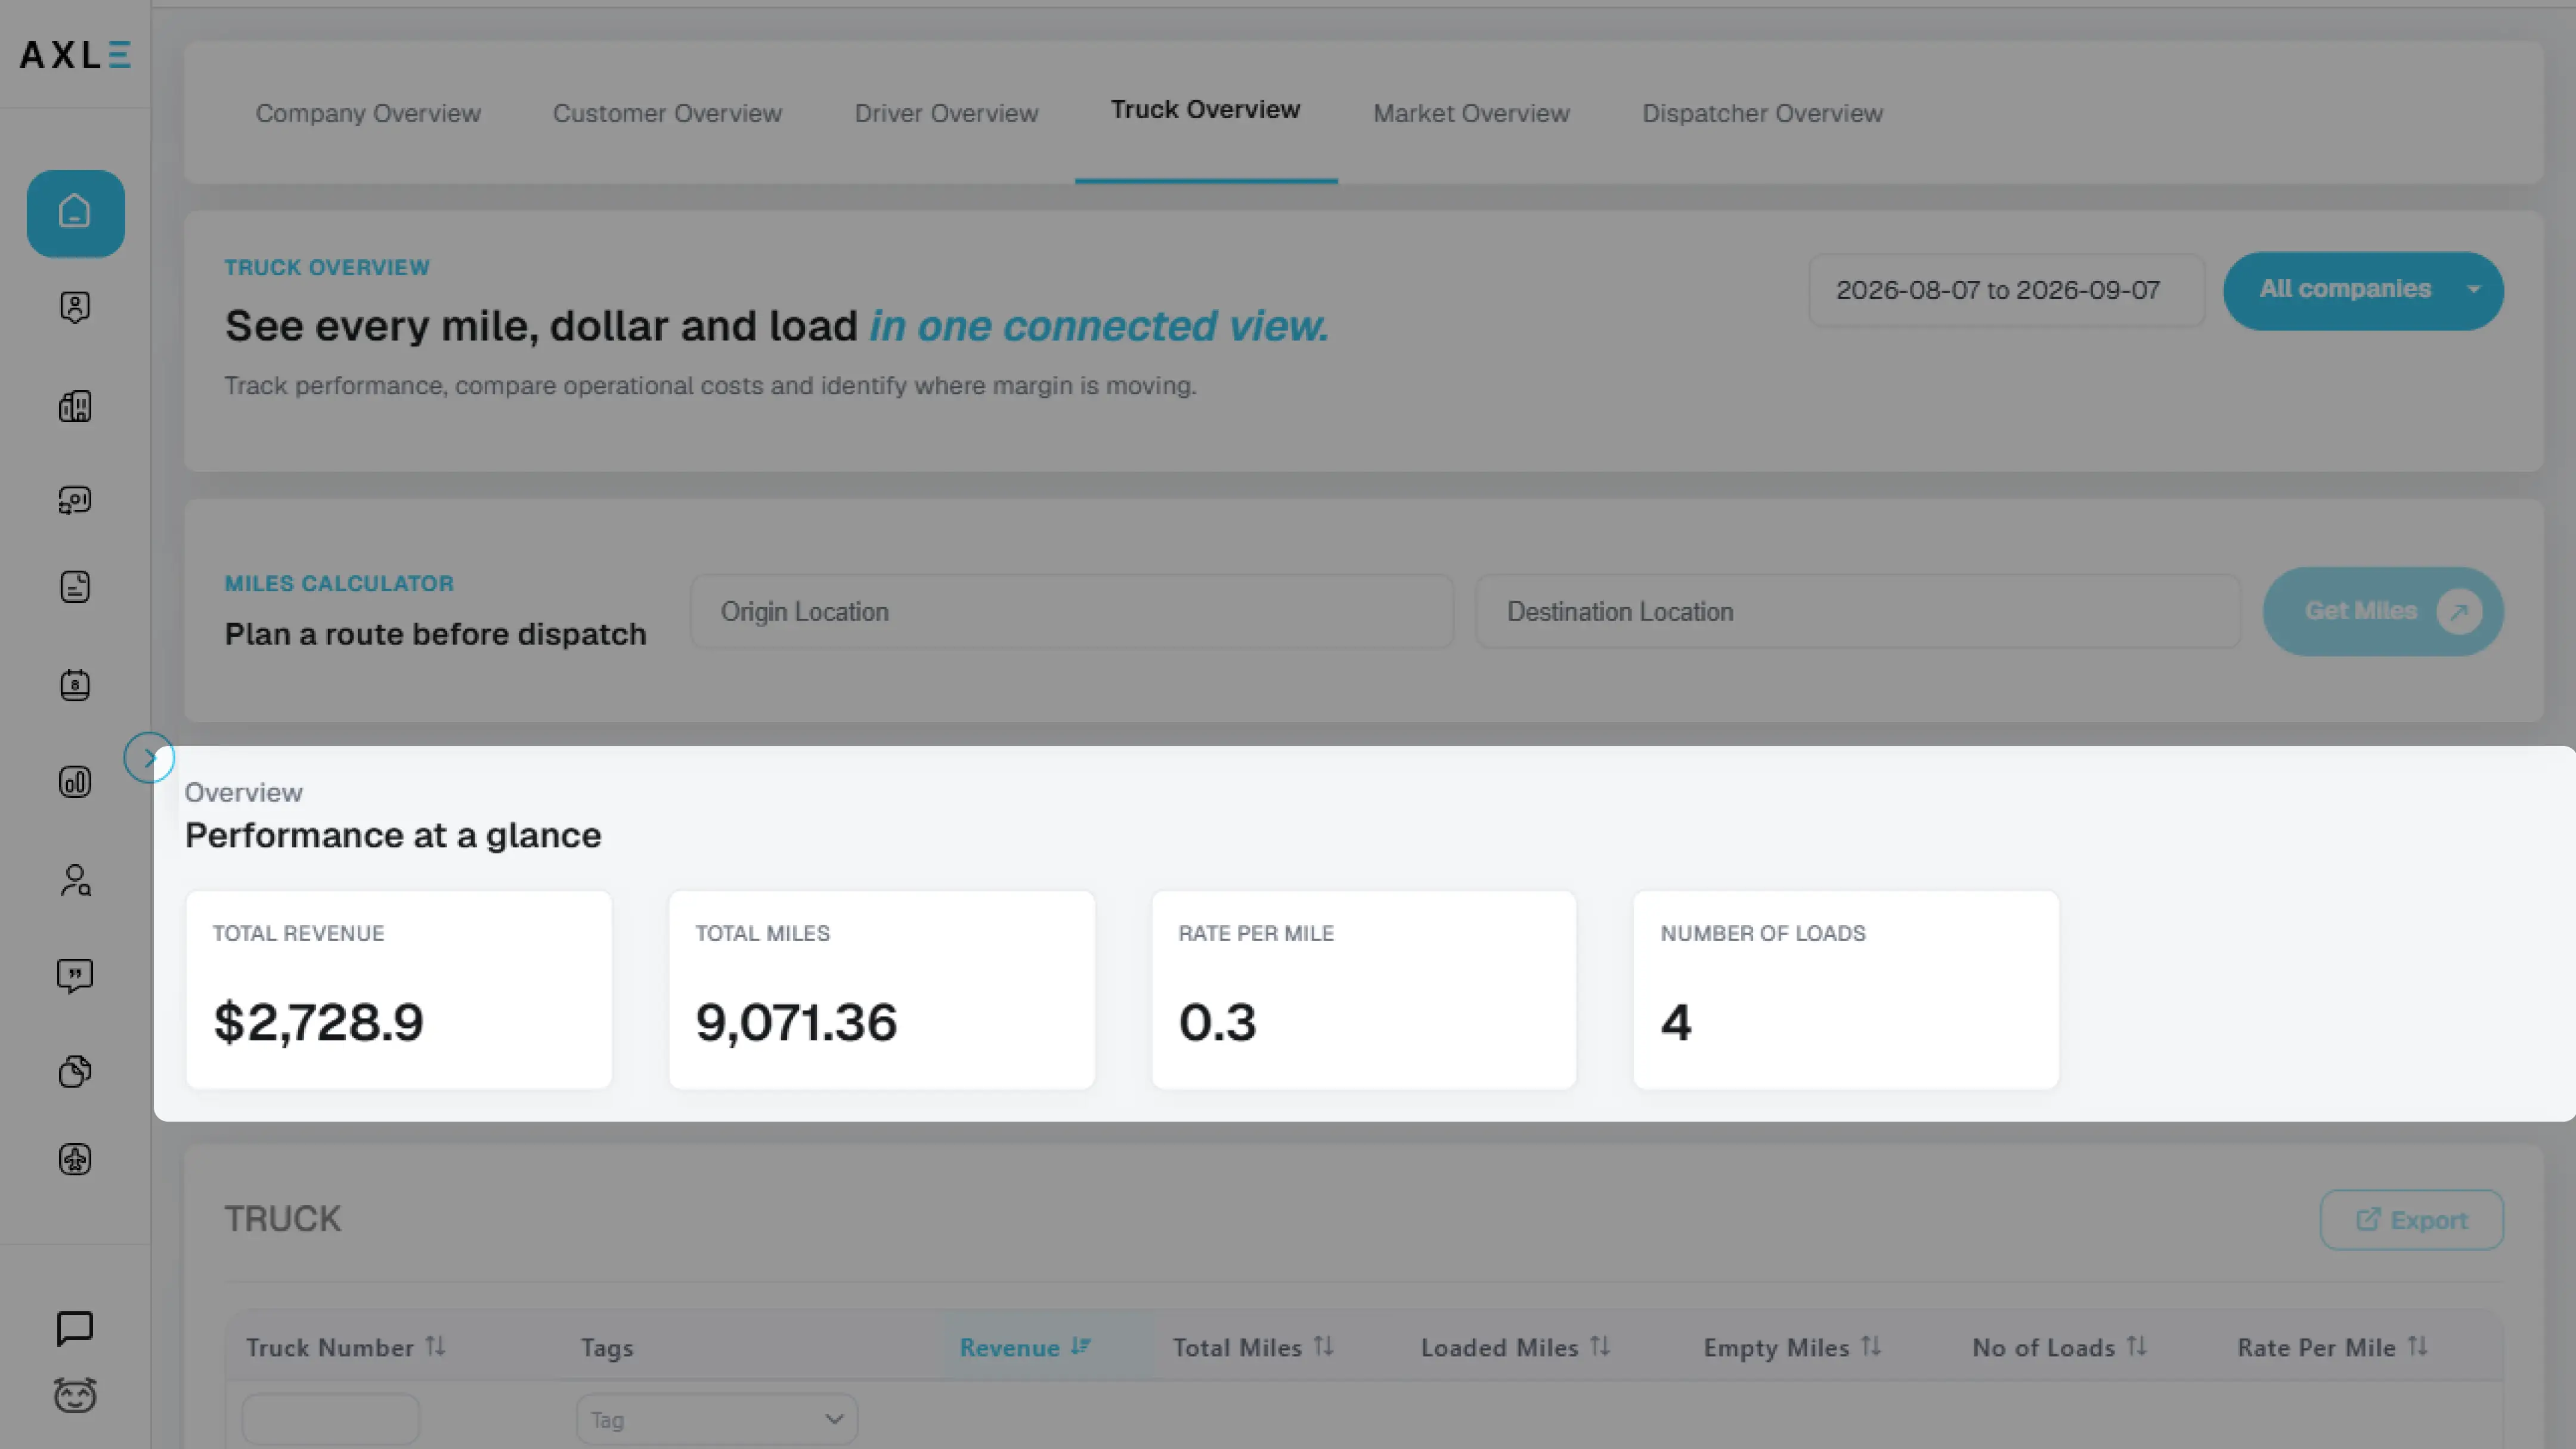
Truck Overview – Fleet Utilization
Provides visibility into how each truck is performing.
Key Metrics:
- Revenue per Truck
- Miles per Truck
Coming Soon:
- Empty Miles Tracking
- Cost per Mile Calculations
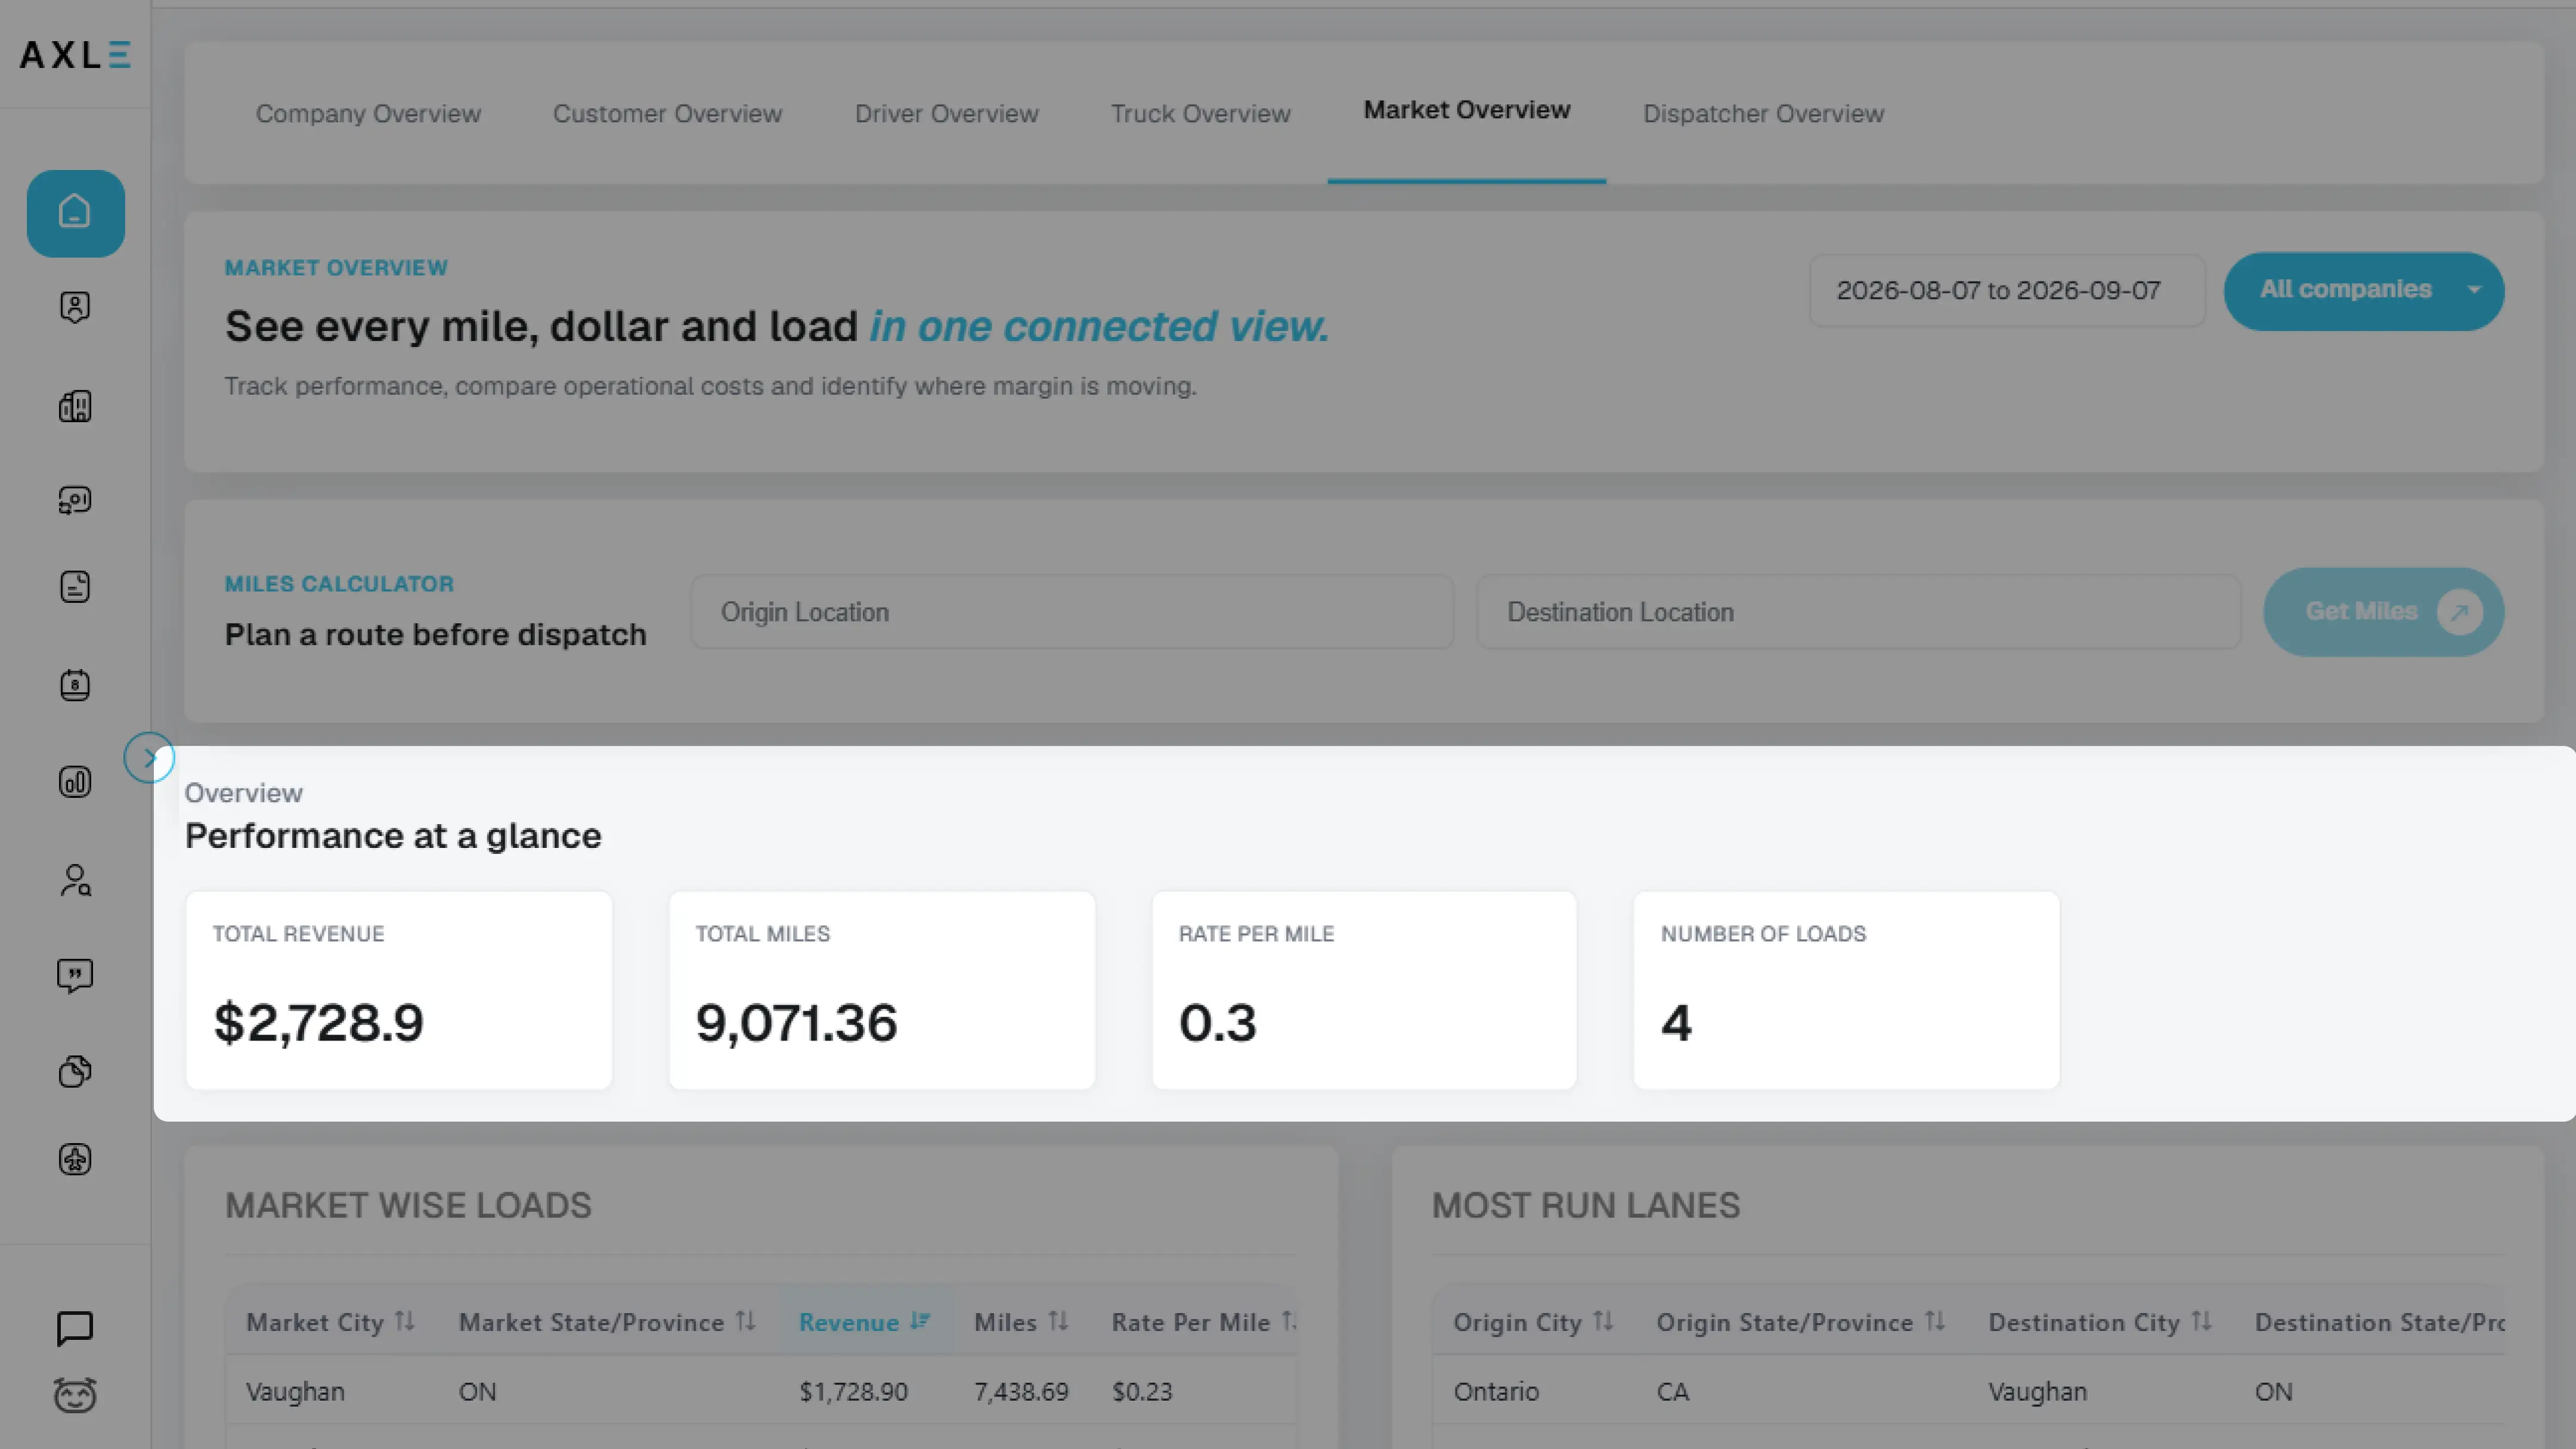
Market Overview – Rate Trends & Lanes
Tracks market-level freight activity to support better pricing and routing decisions.
Key Features:
- Most Run Lanes
- Load Volume by Region
Useful for identifying strong markets and adjusting lane strategies.
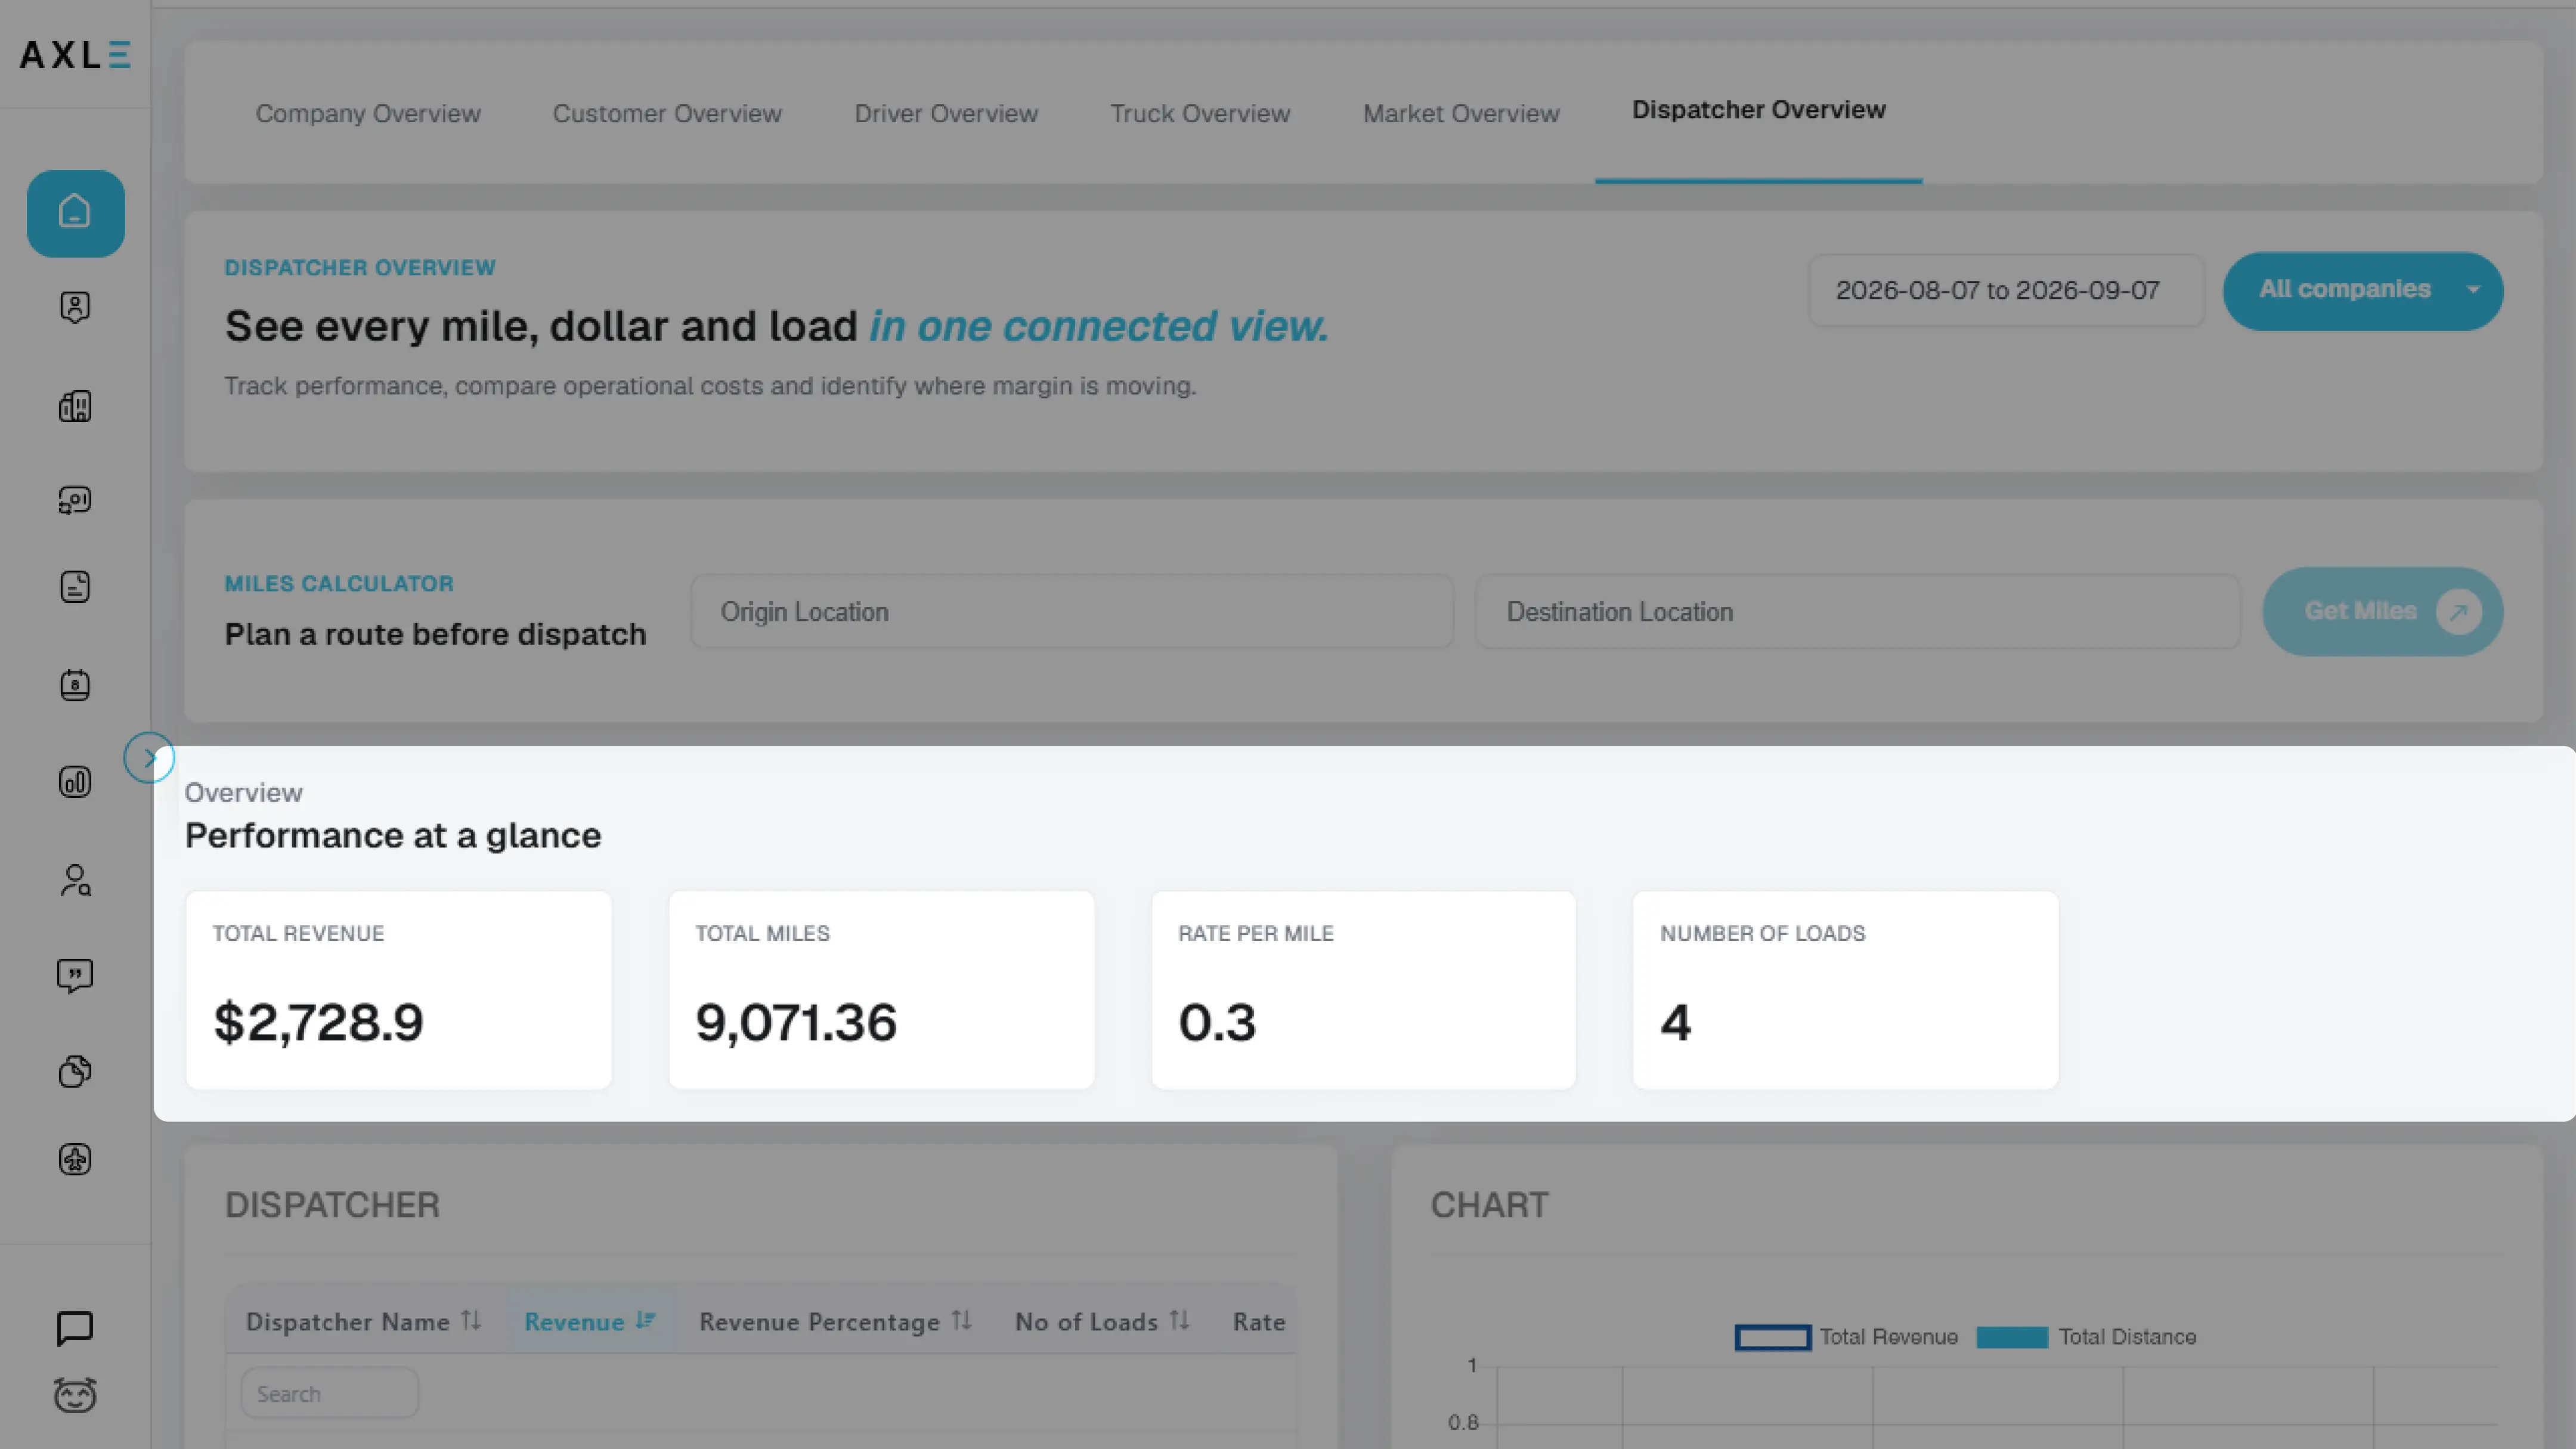
Dispatcher Overview – Team Performance
Tracks how your dispatchers are contributing to operations.
Key Metrics:
- Revenue per Dispatcher
- Loads Managed
- Miles Covered
- % of Company Revenue
Includes graphs to help visualize dispatcher activity and performance.
The Axle Flow Dashboard is designed to help you monitor operations in real time, identify inefficiencies, and make data-backed decisions. Whether you’re reviewing profit margins, dispatch performance, or customer trends, the dashboard gives you the clarity you need to run a more efficient business.
If you need further assistance, please contact help@Axle Flow.io